Gallery

These example images have been generated using pepper's built-in reports. The corresponding command-line arguments for pepper are listed below the thumbnails. In order to achieve similar output in quality and color, you should use the pngcairo terminal and place this .gnuplot file in your home directory. The Gnuplot style has been mostly copied from this GuidoLabs article.

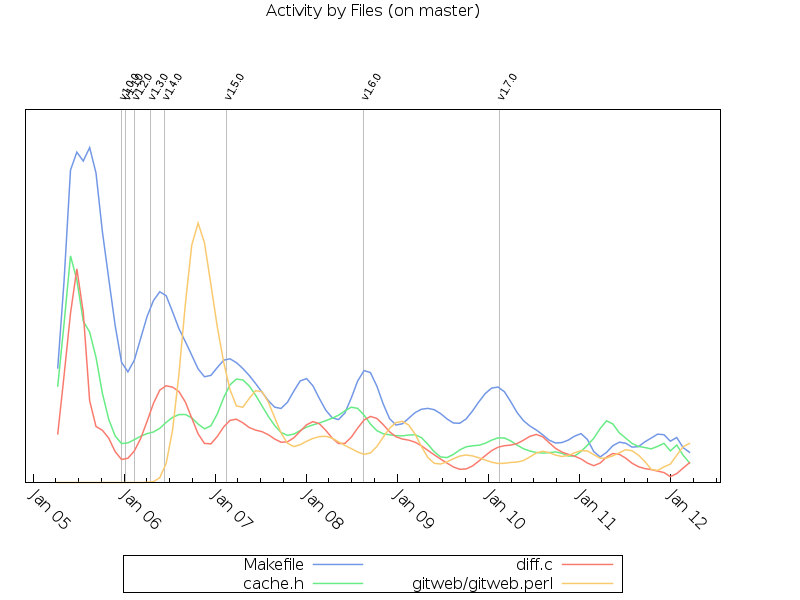
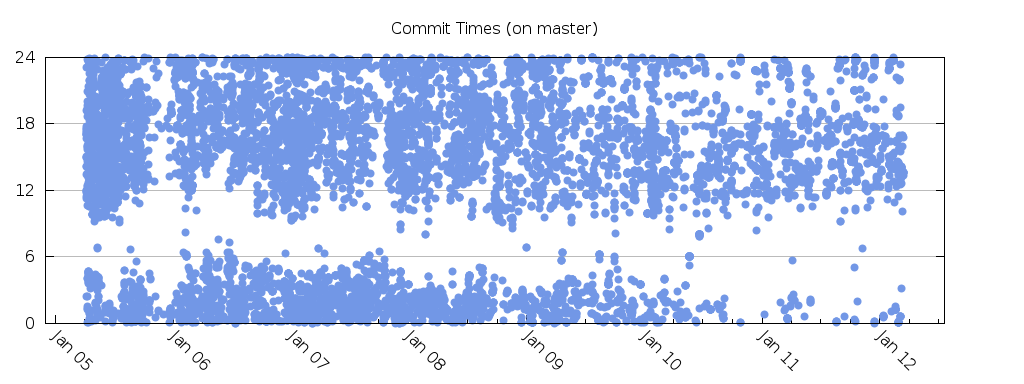
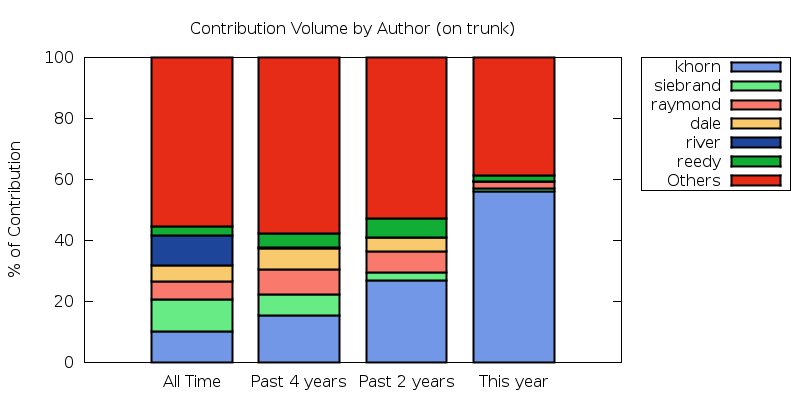
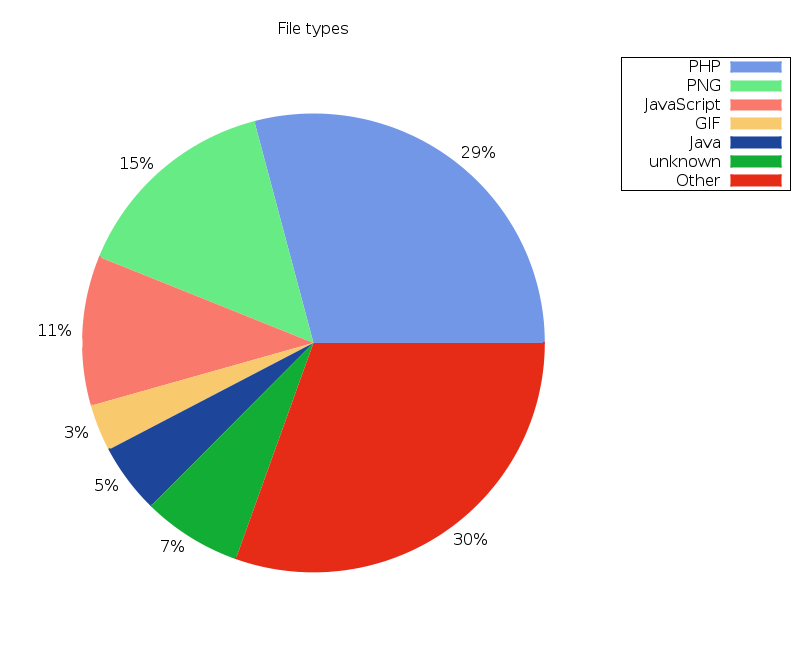
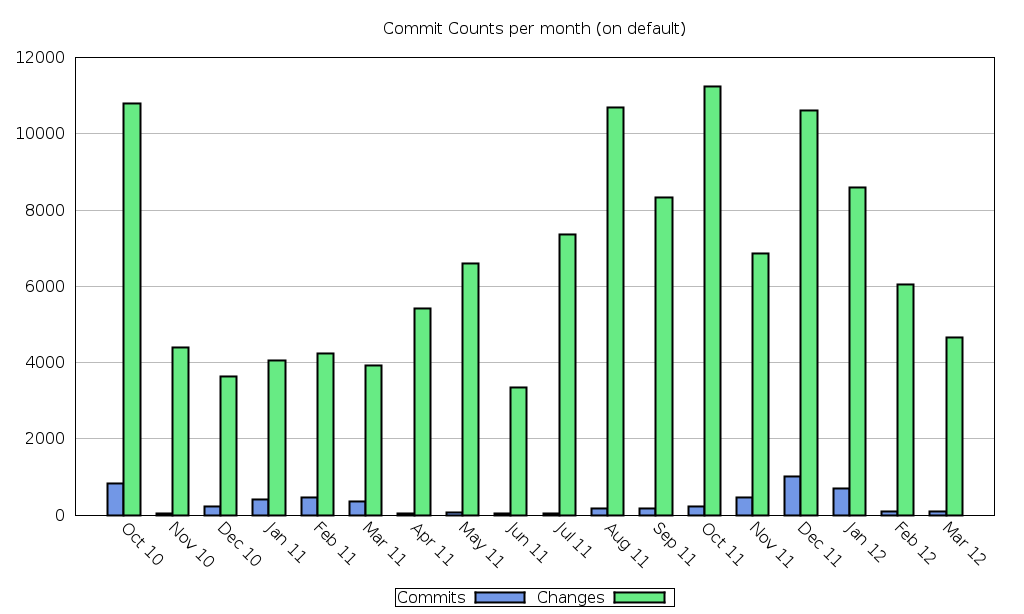
Several large repositories of free and open-source software have been used for generating the reports below (the links to the repositories can be found in the respective captions). Please click on an image to access its full-resolution version.


Mercurial: Lines of code


loc --tags="^%d.%d$"

Mercurial: Code contribution by author


authors --tags="^%d.%d$"

Mercurial: Most active directories


activity --split=d -n4 --tags="^%d.%d$"

Linux: Most active directories


activity --split=d --tags="^v[%d%.]+$"

Linux: Punchcard for Linus Torvalds


pepper punchcard --author="Linus Torvalds"

Git: Most active files


activity --split=f -n4 --tags="^v%d%.%d%.0$"

Git: Commit times


times"

Mediawiki: Contribution by Author


volume -c --slots=a,4y,2y,y

Mediawiki: File types


filetypes --pie trunk

Firefox: Commits over past 18 months


commit_counts --period=18m

Firefox: Most active authors


activity --split=a